Monitoring alerts
Alerts from your monitoring tools become tickets on the right client, and repeats join the ticket that is already open.
Needs: Monitoring module
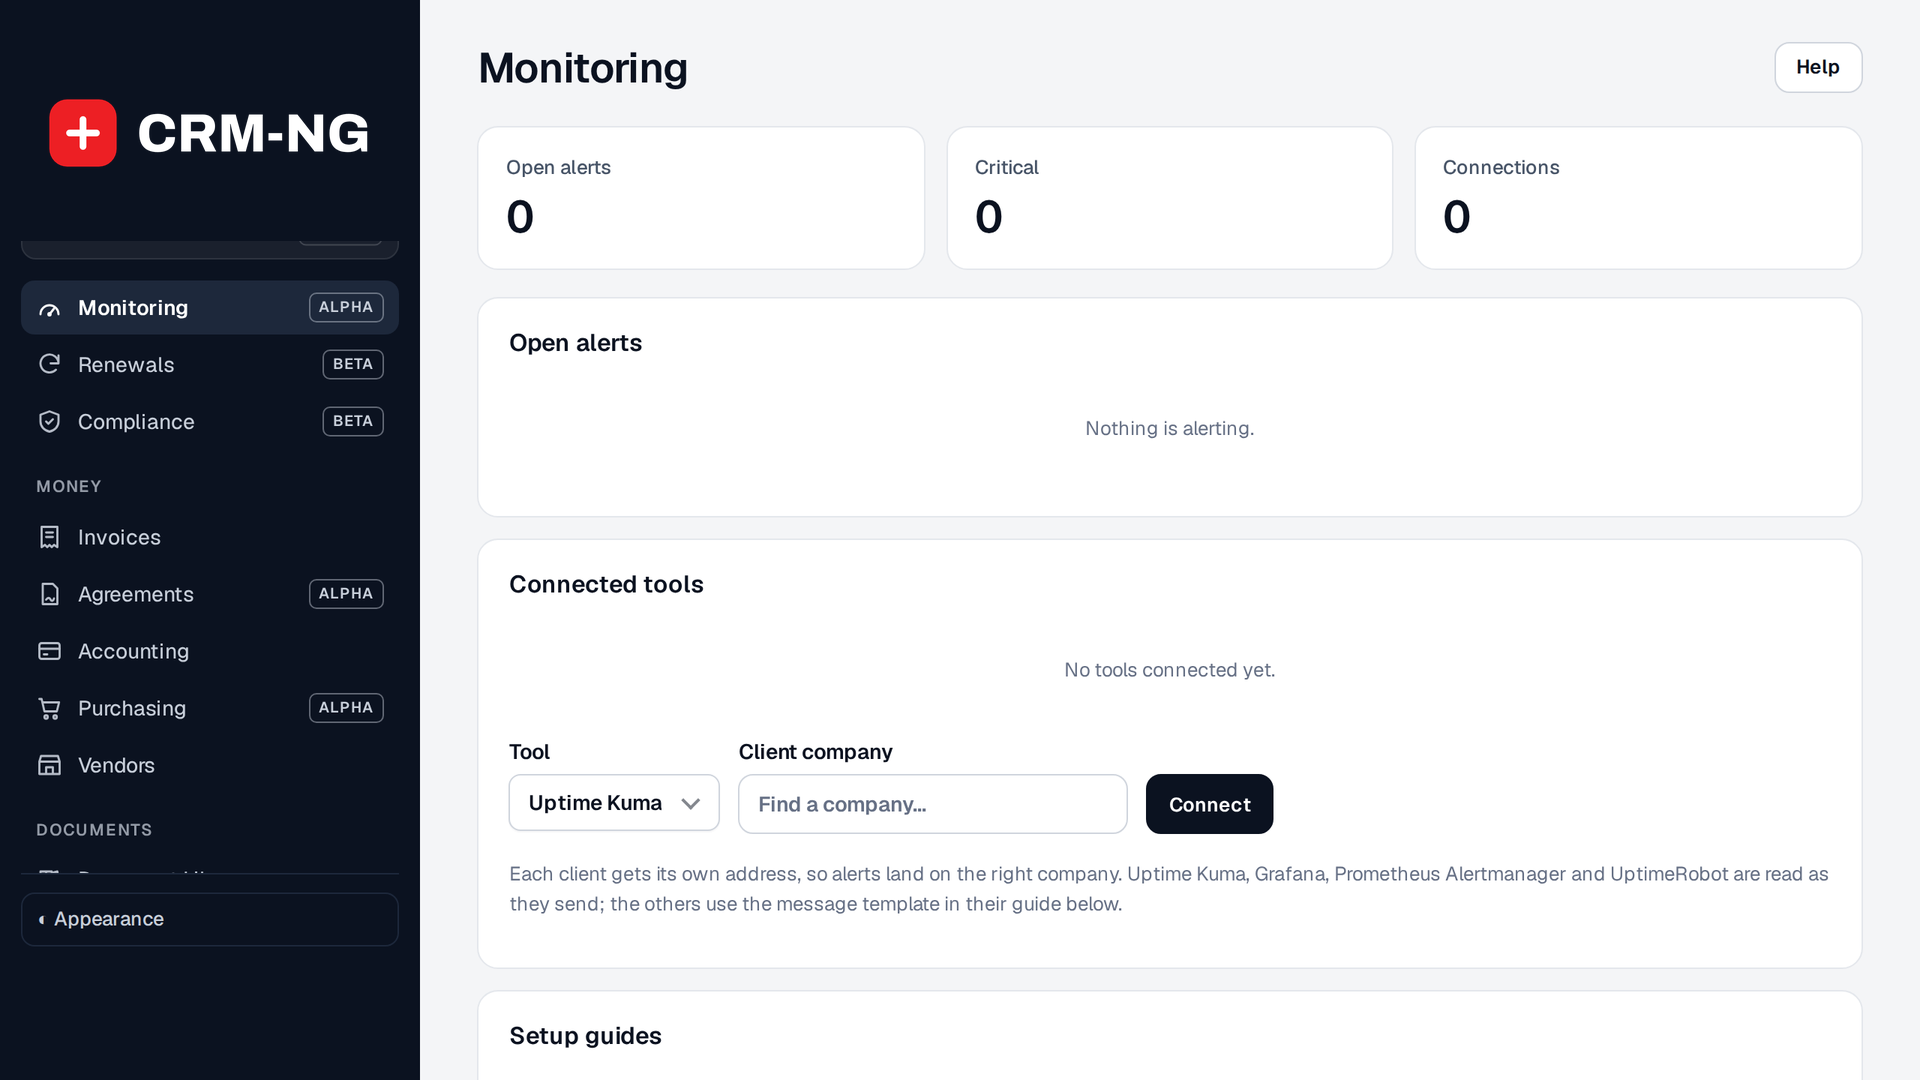
Monitoring: open and critical alerts, and Connect a tool with the client company it belongs to.
Connect a monitoring tool once per client company. When it reports a problem, CRM-NG opens a ticket for that company; when the same problem repeats, it is added to the open ticket instead of creating another; when the tool reports recovery, the ticket is updated.
Connect a tool
- Open Monitoring and choose Connect a tool.
- Pick the tool and search for the client company.
- Choose what makes a ticket: critical and warning, critical only, or list only (alerts are recorded but no ticket is opened).
- Follow the setup guide shown for your tool: it gives the address to send alerts to and, where needed, the message template to paste.
Grafana alerting, Prometheus Alertmanager, UptimeRobot and Uptime Kuma are read directly. Datadog, Zabbix, PRTG, Checkmk and Nagios/Icinga use a ready-made message template. Severity words are understood per tool, so "Disaster", "High" or "P1" become critical and "OK", "Recovered" or "Up" mark the alert resolved.
Limits and safety
Each connection has its own secret address. Alerts are counted against a limit of 120 a minute per connection, so a storm of alerts can't flood your ticket queue; alerts past the limit are dropped.
Client health
For companies with a connected tool, Monitoring alerts becomes one of the factors in their client health score: 100, less 30 for each open critical alert and 10 for each warning.